Introduction
Compare specific energy consumption (SEC) figures across the world’s top-performing SWRO plants and a pattern emerges quickly: the best performers aren’t necessarily running the newest technology. They’re running ordinary, well-understood technology, applied through a small set of deliberate engineering decisions made at the design stage and reinforced through operation. The gap between a top-quartile plant (commonly in the 2.5–3.2 kWh/m³ SEC range for modern seawater applications) and an average one (often 3.8–4.5 kWh/m³ under comparable feed conditions) isn’t usually one breakthrough — it’s seven decisions, made consistently, that compound into a materially different cost structure.
This isn’t a technology comparison piece. It’s a breakdown of the decisions — some made on the drawing board, some made in the control room — that separate plants operating near their theoretical efficiency ceiling from plants leaving real performance on the table.
1. Energy Recovery Device Selection and Sizing
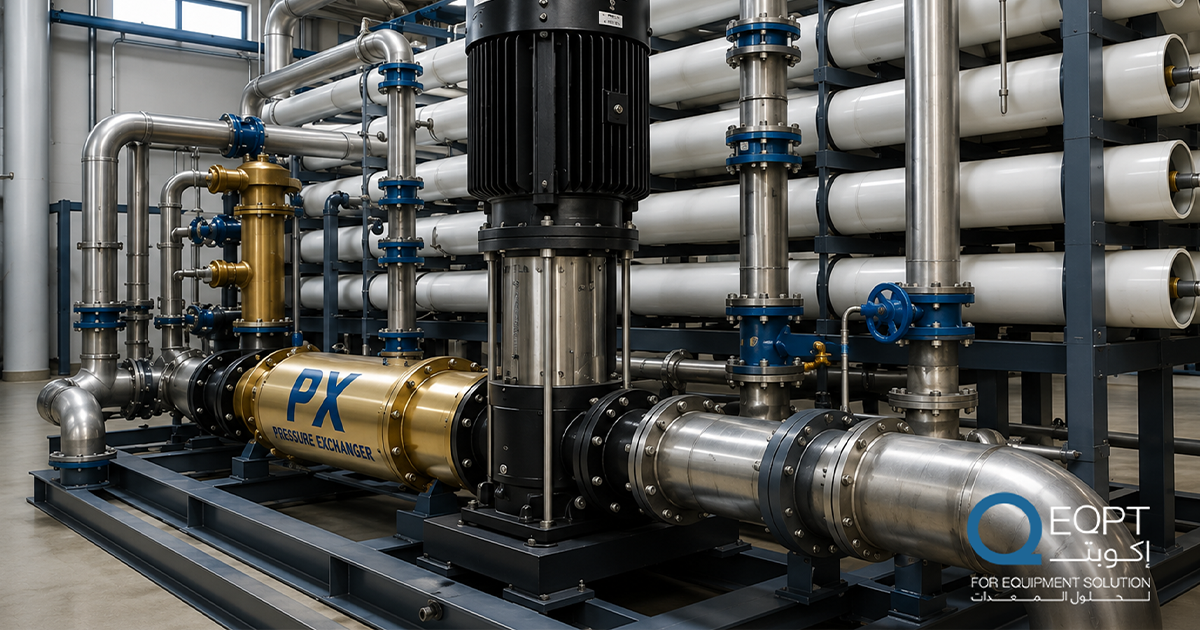
The single largest energy line item difference between SWRO plants is almost always the energy recovery device. Isobaric pressure exchangers now recover over 95% of the hydraulic energy in the reject stream, compared to 85–90% for older Pelton-wheel-based turbochargers. In practical terms, that efficiency gap alone typically accounts for 0.4–0.8 kWh/m³ of net SEC difference in a comparable seawater application, depending on recovery rate and reject flow fraction — as detailed in our companion piece on why identical RO plants diverge in energy consumption.
But selection alone isn’t the full decision — sizing the ERD correctly against actual operating flow ranges, rather than a single design point, determines whether that efficiency advantage holds up across the plant’s real operating envelope, including partial-load and seasonal variation. An isobaric PX sized tightly to one design flow can see its volumetric efficiency degrade measurably outside a roughly ±15–20% flow band around that point — which matters in plants with meaningful seasonal feed variability, where “the design point” is only true a few weeks a year.
2. Variable-Speed Pumping Matched to Real Operating Range
High-efficiency plants pair energy recovery with variable-frequency-drive (VFD) high-pressure pumps sized and controlled to track actual feed conditions rather than a fixed design point. A pump running at a fixed speed and throttling to control flow wastes energy as pressure drop across a control valve — energy that VFD-based flow control avoids by adjusting pump speed directly.
The magnitude is easy to underestimate. Using the standard hydraulic-power relationship P(kW) ≈ Q(m³/h) × ΔP(bar) ÷ 36, a train flowing 1,000 m³/h through a control valve throttling an unnecessary 3 bar is burning roughly 83 kW continuously just to create and then destroy that pressure differential — before accounting for motor and pump efficiency losses on top. Run continuously across a year, that single throttling loss is on the order of 700,000+ kWh, entirely avoidable with speed control matched to actual demand. This decision matters disproportionately in plants with significant seasonal feed variability, where a fixed-speed system is either oversized for most of the year or undersized during peak conditions.
3. Recovery Rate Set Against Actual Feed Chemistry, Not a Generic Design Basis
Recovery rate has a nonlinear relationship with both energy consumption and scaling risk, and the mechanism is a straightforward concentration factor: CF = 1 ÷ (1 − recovery fraction). Moving recovery from 45% to 50% raises the concentration factor from 1.82 to 2.0 — roughly a 10% increase in concentrate-side salinity and, with it, concentrate osmotic pressure, which is why over-recovering relative to feed chemistry raises SEC and scaling risk together rather than trading one against the other.
Top-performing plants set recovery rate based on the specific feed water chemistry at their site — salinity, temperature, and scaling indices such as the Langelier Saturation Index (LSI) for calcium carbonate or the Stiff-Davis index for higher-salinity brines — rather than applying a generic industry-standard recovery figure. Pushing recovery higher than feed chemistry comfortably supports increases both energy demand and antiscalant dependency; setting it conservatively low leaves capacity and cost efficiency on the table. The decision to calibrate recovery rate specifically to site conditions, and revisit it as conditions change seasonally, is a recurring differentiator in plant performance benchmarking.
4. Pretreatment Selection Matched to Intake Water Quality

Efficient plants don’t default to a standard pretreatment package — they select pretreatment technology (conventional media filtration versus ultrafiltration, for example) based on actual intake water quality characteristics, including seasonal biological loading and organic content. The comparison point operators actually use is Silt Density Index (SDI₁₅, per ASTM D4189): conventional media filtration commonly delivers RO feed in the SDI 3–5 range under typical conditions, while UF pretreatment typically holds SDI below 1 regardless of moderate seasonal feed variability — a meaningfully wider safety margin against the fouling that drives both cleaning frequency and effective SEC upward.
A plant with chronic biofouling risk that under-invests in pretreatment pays for that decision continuously, through higher cleaning frequency, more frequent membrane replacement, and higher effective specific energy consumption once fouling-related pressure losses are accounted for.
5. Staged Membrane Array Design with Interstage Consideration
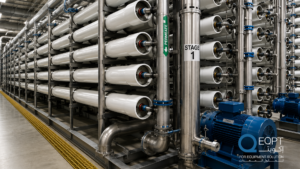
Membrane array configuration — the number of stages, the use of interstage boosting where appropriate, and the balance between stages — affects both permeate quality and the pressure profile required across the train. A typical two-stage seawater array tapers vessel count between stages (commonly around a 2:1 ratio) specifically to maintain adequate crossflow velocity as flow decreases along the train; get that ratio wrong and the tail end of the array either fouls faster (velocity too low) or is starved of flux (velocity too high relative to available driving pressure).
Where feed salinity or recovery targets push concentrate osmotic pressure high enough that the lead elements would otherwise need to be over-pressurized to compensate, an interstage booster pump lets the array add pressure exactly where it’s needed — at the tail end — rather than raising feed pressure at the train inlet to compensate for a condition that only exists downstream. Plants engineered with array design optimized for the specific feed salinity and recovery target, rather than a standard array template, typically achieve target permeate quality at a lower overall feed pressure than a generically configured train.
6. Instrumentation and Control Philosophy Built for Real-Time Optimization
Efficient plants treat instrumentation as a control asset, not just a compliance requirement. This means calibrated, well-maintained pressure, flow, and conductivity instrumentation feeding control logic that can adjust setpoints dynamically — rather than static setpoints locked at commissioning and left unchanged for years.
The instrumentation point is worth being specific about: a high-pressure transmitter with a stated accuracy of ±0.1–0.25% of full scale that’s allowed to drift several times beyond that tolerance will feed a control loop that’s chasing an inaccurate setpoint continuously, which is a small but real energy cost hiding inside what looks like a perfectly healthy control system. The difference between a plant with static control logic and one with dynamic, feed-forward, condition-based control is one of the most consistent gaps identified in third-party performance audits.
7. A Culture of Continuous Performance Benchmarking
The seventh decision isn’t a piece of equipment — it’s an operating discipline. Top-performing plants track normalized Specific Energy Consumption (SEC), ERD efficiency, and pump efficiency as ongoing KPIs, not annual review items, and they benchmark performance against both the plant’s own historical baseline and external industry data. Some formalize this within an ISO 50001 energy management system framework, which provides a structured basis for continuous monitoring, targeting, and corrective action rather than relying on ad hoc review cycles.
This continuous benchmarking is what catches gradual efficiency drift — a slowly degrading pump, a slightly underperforming ERD — before it becomes a multi-year pattern that’s expensive to reverse. Critically, raw SEC has to be normalized for feed temperature and salinity before it’s benchmarked at all; comparing unnormalized SEC across a seasonal boundary produces a false read almost every time, which is a detail covered in more depth in our companion article on RO energy optimization.
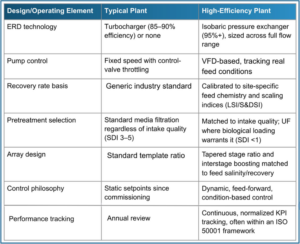
Comparative Snapshot: Typical vs. High-Efficiency Plant Characteristics
Engineering Recommendations
- Size ERDs against the full expected operating range (roughly ±15–20% of design flow), not just the nominal design point, particularly for plants with seasonal feed variability.
- Evaluate VFD retrofits on existing fixed-speed pumping systems wherever a control valve is routinely throttling more than 1–2 bar at normal operating flow — that differential converts directly into avoidable kW using P(kW) ≈ Q(m³/h) × ΔP(bar) ÷ 36.
- Revisit recovery rate against current feed chemistry and scaling indices (LSI/S&DSI), rather than the original design basis, especially if the plant has been operating for several years.
- Match pretreatment technology to actual, not assumed, intake water quality, benchmarking against SDI₁₅ rather than a generic “seawater-rated” assumption.
- Audit array configuration and interstage boosting against current feed salinity and recovery targets, particularly for plants that have shifted recovery or capacity since commissioning.
- Move from static to condition-based, feed-forward control logic wherever instrumentation accuracy and control system capability allow it.
- Establish continuous, normalized KPI tracking — SEC, ERD efficiency, pump efficiency — ideally within a structured framework such as ISO 50001, rather than relying on periodic or annual performance reviews alone.
Conclusion
The world’s most efficient desalination plants aren’t running fundamentally different technology from average performers. They’re making seven specific, deliberate engineering decisions — at design stage and in daily operation — and reinforcing them through continuous, normalized performance tracking rather than treating efficiency as a one-time commissioning target. For plant owners and EPC teams benchmarking their own facilities, these seven decisions are a practical starting checklist, not a theoretical ideal.
Call to Action
EQPT Solutions supports plant owners and EPC teams across Saudi Arabia with desalination plant design review, energy optimization studies, and operational performance audits. If you’re benchmarking your plant against top-tier performance, our engineering team can help identify which of these seven decisions represents your biggest opportunity.
FAQ
Q: What makes a desalination plant “efficient” compared to an average plant?
Efficiency differences typically come down to seven specific engineering decisions — ERD selection and sizing, VFD-based pump control, recovery rate calibration against feed chemistry, pretreatment matching, array design with interstage boosting, dynamic control philosophy, and continuous normalized performance tracking — rather than a single technology difference.
Q: How much energy can an Energy Recovery Device (ERD) save in a SWRO plant?
Isobaric pressure exchangers recover over 95% of the hydraulic energy in the reject stream, compared to 85–90% for older turbocharger-based systems — a gap that typically accounts for roughly 0.4–0.8 kWh/m³ of net specific energy consumption difference in a comparable seawater application.
Q: How much energy does throttling a control valve actually waste on a fixed-speed pump?
Using the approximation P(kW) ≈ Q(m³/h) × ΔP(bar) ÷ 36, a train flowing 1,000 m³/h through a valve throttling an unnecessary 3 bar is burning on the order of 83 kW continuously — a loss that VFD-based speed control largely eliminates.
Q: Should recovery rate be the same for every SWRO plant?
No. Recovery rate should be calibrated to site-specific feedwater chemistry and scaling indices such as LSI or Stiff-Davis, rather than applied as a generic industry-standard figure, since pushing recovery too high or too low relative to feed conditions affects both energy consumption and scaling risk together.
Q: What SDI value should RO feed water target after pretreatment?
Conventional media filtration typically delivers RO feed in the SDI 3–5 range, while ultrafiltration pretreatment typically holds SDI below 1 — a materially wider fouling safety margin that matters most in intakes with significant seasonal biological loading.
Q: How often should a desalination plant’s performance be benchmarked?
Top-performing plants track normalized SEC, ERD efficiency, and pump efficiency continuously — some within a structured ISO 50001 energy management framework — rather than relying on annual reviews, which allows gradual efficiency drift to be caught and corrected early.